
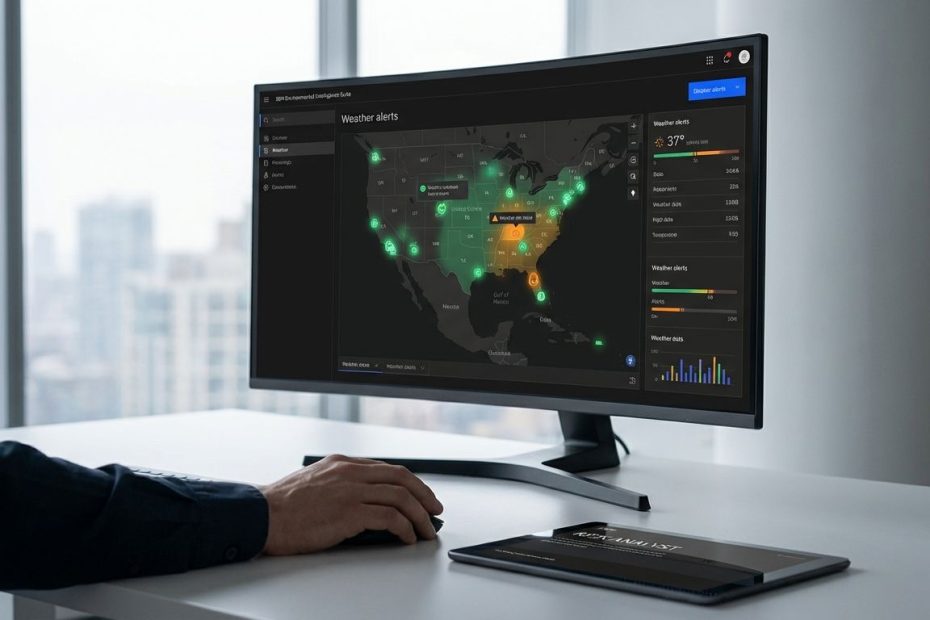
IBM’s Environmental Intelligence Suite (EIS) helps you operationalize climate risk management by turning weather, geospatial, and emissions-related data into APIs, alerts, and analytics you can embed into daily decisions. When it’s deployed well, it tightens forecasting, improves asset exposure scoring, and keeps disruption response measurable.
This guide walks through what EIS is, what hazards and datasets it covers, how the APIs work in real deployments, what teams learn the hard way about reliability and outage planning, how pricing is typically described in the market, and when public data sources like NOAA Climate Data Online (CDO) can be enough. The focus stays on execution, governance, and operational fit, so you can move from pilot to production without surprises.
What Is IBM Environmental Intelligence Suite (EIS), And How Does It Help With Climate Risk Management?
EIS is best treated as an environmental data-and-analytics layer that plugs into the systems your teams already run: asset management, supply chain visibility, fleet operations, EAM, GIS, risk engines, and sustainability reporting. Instead of building every ingestion pipeline and geospatial join from scratch, you use IBM-managed APIs and curated datasets to detect risk conditions, quantify exposure, and trigger action. That is the core value, speed to operational signal, not a one-off dashboard. Reference: IBM Environmental Intelligence product overview and positioning.
In climate risk management terms, you use EIS to handle three jobs that usually break internal teams at scale: consistent environmental inputs, repeatable spatial analysis, and decision-grade outputs. You ingest environmental conditions, connect them to your asset footprint, then convert the result into thresholds, alerts, and risk scoring that operations leaders can own. This is where climate risk stops being a report and becomes an operational control.
To make that control real, the best deployments keep EIS close to workflows. A utility ties wildfire layers and fire danger indexes to feeder-level assets and work orders. A logistics team ties forecast conditions to lane disruption rules and carrier performance. A facilities group ties heat risk to labor planning and site safety controls. The product matters, the operational contract matters more: who gets alerted, what response is expected, and how performance is measured.
What Datasets And Climate Hazards Does IBM EIS Cover, And How Often Is It Updated?
EIS publishes a data catalog that is organized around practical building blocks: geospatial layers, forecast and historical weather, satellite imagery, and emissions-related data. IBM explicitly describes “hundreds of GIS layers” from diverse sources and calls out coverage areas teams actually use in resilience programs, including air quality, wildfires, ocean conditions, and economic trends. Reference: IBM Environmental Intelligence Data Catalog.
Update cadence is not a footnote, it drives your ability to run “always-on” risk. IBM lists monthly seasonal forecasts produced at monthly intervals from February 1981 to present, which is useful for planning windows that exceed short-range weather. IBM also describes current and historical weather on a 4km landmass and coastal waterways grid with hourly data back to July 2015, which is more aligned to operational alerts and near-term decisioning. Reference: IBM Environmental Intelligence Data Catalog.
For imagery and broader hazard monitoring, IBM lists satellite sources in the catalog, including Sentinel-2 and Landsat 8, with daily update intervals in multiple countries, plus Sentinel-1 radar imagery with an every-10-days update interval. For wildfire-related use, the catalog lists daily spatial grids of fire danger indexes and daily wildfire risk potential derived from USDA and USGS work. These details matter because your risk program is only as stable as your refresh rate and spatial resolution. Reference: IBM Environmental Intelligence Data Catalog.
When you map this into a climate risk operating model, the best results come from separating time horizons. Short-range forecasts drive operational actions and alerts. Seasonal forecasts drive capacity planning, maintenance windows, inventory positioning, and budgeting assumptions. Historical data drives baselines, validation, and model training, then gets locked into governance so teams do not “chase the weather” with constantly moving benchmarks.
How Do EIS APIs Work In Practice, And What Does Implementation Look Like?
EIS is positioned around APIs that let you query and analyze environmental data without building a custom geospatial platform end-to-end. IBM describes a wide-ranging set of APIs that cover geospatial queries and weather analytics, plus greenhouse gas emissions calculations, with developer enablement through IBM-managed credentials and tooling. Reference: IBM Environmental Intelligence APIs page.
Implementation usually starts as a controlled pilot with a small asset subset and one or two hazards. That pilot proves three things: data fit (coverage, refresh, spatial accuracy), business fit (the alert thresholds match how operations work), and technical fit (latency, auth, logging, and integration into your data estate). When those are validated, teams productionize via scheduled jobs, event-driven triggers, or integration into analytics platforms, then add governance, auditability, and change control for thresholds and scoring models.
On the geospatial side, IBM maintains the ibmpairs SDK documentation that shows a clear on-ramp for developers, including installation via pip and a structured “quick start” that emphasizes credential setup, tenant or org configuration, and sample workflows commonly run in notebooks. That is a practical signal: the fastest route to value is proving queries and outputs in an analytics environment, then hardening them into services that operations can depend on. References: ibmpairs Installation and Quick Start docs.
Production readiness comes down to how you design interfaces and failure modes. A data science notebook that runs once is not a risk control. A production service needs rate control, caching, retries, versioned payloads, and a contract for what happens when data is delayed. EIS can reduce build time, yet your team still owns operating discipline: runbooks, monitoring, and how alerts convert to actions.
How Accurate And Enterprise-Ready Is IBM EIS, And What Do Users Complain About?
Third-party review sites tend to show a consistent pattern: users value breadth of capability and proactive decision support, then raise concerns about complexity and cost. On G2, review themes commonly highlight strong weather and geospatial coverage, alerting value, and decision support benefits, paired with complaints about setup effort, integration complexity, and pricing perceived as high or hard to predict. Reference: G2 IBM Environmental Intelligence Suite reviews listing.
Those complaints are not deal-breakers, they are signals you can plan around. Setup complexity usually means data mapping and integration work was underestimated: asset hierarchies are messy, location accuracy varies, and business rules change by region. Pricing concerns usually mean the team started with a broad wish list instead of a tight scope and measurable outcomes. Enterprise software does not forgive vague objectives, so the program needs hard prioritization.
Enterprise readiness also includes operational resilience, vendor support pathways, and predictable maintenance windows. IBM publishes outage and scheduled maintenance pages for EIS, which should be treated as required reading for any team building mission-critical workflows. This is where platform governance stops being theoretical and becomes part of your architecture. Reference: IBM Support outage and maintenance announcements pages.
How Much Does IBM Environmental Intelligence Suite Cost, And What Pricing Tiers Exist?
Public pricing for EIS is typically not posted as a single definitive list, and that is common for enterprise offerings tied to API volume, datasets, and support requirements. Third-party software listing sites often publish directional tiering and “starting at” estimates that teams use for early budgeting, then confirm directly with IBM during procurement. Reference: Software Advice EIS listing.
Software Advice lists tier-like pricing figures that are commonly repeated in the market as rough anchors, including a low entry point around $500/month and higher tiers around $3,750 and $10,000, typically described in Essentials or Standard or Premium terms depending on the listing. Treat these as budgeting hints, not contractual pricing, since final cost depends on required data coverage, API throughput, retention needs, and commercial terms. Reference: Software Advice EIS listing.
To control cost and prevent disappointment, align scope to business value before you request a quote. Lock one hazard and one workflow, define volume expectations, define target latency, and define what “good” looks like in operational KPIs. A climate risk platform purchase without measurable output becomes an expensive data feed that nobody trusts.
What Are The Best Alternatives To IBM EIS For Climate Risk, And When Should You Use NOAA Or Other Free Data Instead?
If the requirement is raw climate and weather data access, NOAA Climate Data Online (CDO) provides publicly accessible services that support programmatic access, including API v2 and data service endpoints, plus other standard interfaces for geospatial and model data access. NOAA’s own FAQ pages state the data available through CDO is available at no charge. References: NOAA CDO Web Services page and NOAA CDO FAQ.
Free data is not free operations. Your team owns ingestion, cleaning, station metadata, spatial joins, missing data handling, documentation, and user-facing workflows. That is doable when there is strong data engineering capacity, stable use cases, and tolerance for longer delivery timelines. It becomes harder when operations demands near-real-time alerting, repeatable scoring, and easy integration into enterprise systems.
EIS fits when speed to operational signal matters and when teams need IBM-managed APIs, curated layers, and a supported path to production. NOAA fits when budget is the primary constraint and the team can own the platform work. Many mature programs run both: NOAA for baseline, validation, and cost control, EIS for standardized geospatial analysis and production alerts tied to assets and workflows.
Is IBM EIS Reliable For Mission-Critical Workflows, And What Do Outage Reports Show?
Reliability is a design requirement, not a vendor promise. IBM publishes a CY:2026 outage and maintenance announcements page for EIS with dated entries, impacted components, and descriptions tied to datasets and system access. This is critical operational information for teams that depend on consistent feeds for alerts, risk scoring, and automated workflow triggers. Reference: IBM Support CY:2026 announcements page.
One specific entry dated January 6, 2026 states IBM experienced problems with the EIS geospatial component impacting access to The Weather Company seasonal forecast data as of January 1, 2026, linked to a hardware failure at the upstream data source with no ETA at the time of the announcement. The page also shows a later modification date of January 16, 2026, indicating updates were posted as the situation progressed. Reference: IBM Support CY:2026 announcements page.
This is where strong climate risk programs separate from dashboard projects. Your architecture needs fallback behavior: cache last-known-good datasets, design alert rules that degrade gracefully, and maintain secondary inputs for high-priority hazards when feasible. Operational teams also need runbooks that explain what changes when a seasonal dataset is unavailable, who communicates impacts, and how long the business accepts partial coverage.
What Is IBM Environmental Intelligence Suite Used For?
- Weather and geospatial risk monitoring for assets
- Alerts and forecasts to reduce disruption
- Risk scoring using environmental datasets via APIs
Put EIS To Work Where Climate Risk Actually Hits
IBM Environmental Intelligence Suite can help you predict exposure and adapt operations when you treat it as an operational control layer, not a reporting tool. You get value by matching hazards to assets, setting thresholds that operations accepts, and wiring outputs into real workflows with monitoring and auditability. The data catalog’s update intervals and coverage details determine what you can automate, and IBM’s support announcements show why resilience planning belongs in your design. Use third-party pricing as a budget placeholder, then force scope discipline before procurement. When NOAA CDO meets the need, keep it in the stack, when you need faster execution and standardized geospatial analysis, EIS earns its place.
References
- IBM Environmental Intelligence (Product Overview)
- IBM Environmental Intelligence APIs
- IBM Environmental Intelligence Data Catalog
- IBM EIS Outage Alerts & Scheduled Maintenance Announcements CY:2026
- IBM Environmental Intelligence Geospatial APIs SDK (ibmpairs) Installation
- IBM Environmental Intelligence Geospatial APIs SDK (ibmpairs) Quick Start Setup
- G2: IBM Environmental Intelligence Suite Reviews
- Software Advice: IBM Environmental Intelligence Suite Pricing and Details
- NOAA NCEI: Climate Data Online (CDO) Web Services
- NOAA NCEI: CDO FAQ (Data Availability and Cost).

Lee Fondiller is a seasoned operations executive with over 20 years of experience in technology and sustainability. As COO of Solar4Pools, he leads innovation in the renewable energy industry with a focus on solar-powered solutions.